
- PMRV
- Activities
- Database
Database
The Participatory Measurement, Reporting and Verification (PMRV) project collected social, health and forestry data and information from the field. The teams also gathered GPS points, and described and took photographs of each point during ground checks. The data forms from the field were then scanned and entered into a database along with relevant literature and a glossary of terminology used in the project.
The data was collected from three regions of Indonesia — Papua, West Kalimantan and Central Java. Due to the amount and complexity of the data, a database system was necessary to centralize data storage, reduce data editing, and facilitate recall and use of the data in accordance with our needs such as for writing reports and articles. The project team chose to use Microsoft Access software (MS Access). The software is part of the Microsoft Office package based on Windows, and can be modified to be made more user-friendly. It accommodates the creation of tables, forms, queries and crosstabs, and the establishment of links between them. The entered data can be accessed according to location, type of data, specific parts of the data, or a combination of factors by creating a query. The software is also compatible with Microsoft Excel, which is useful for data exporting and importing, particularly for data analysis using programs such as SPSS.
More than 30 database tables and many sub-tables have been produced so far. Currently, the data and tables are organized into four main groups:
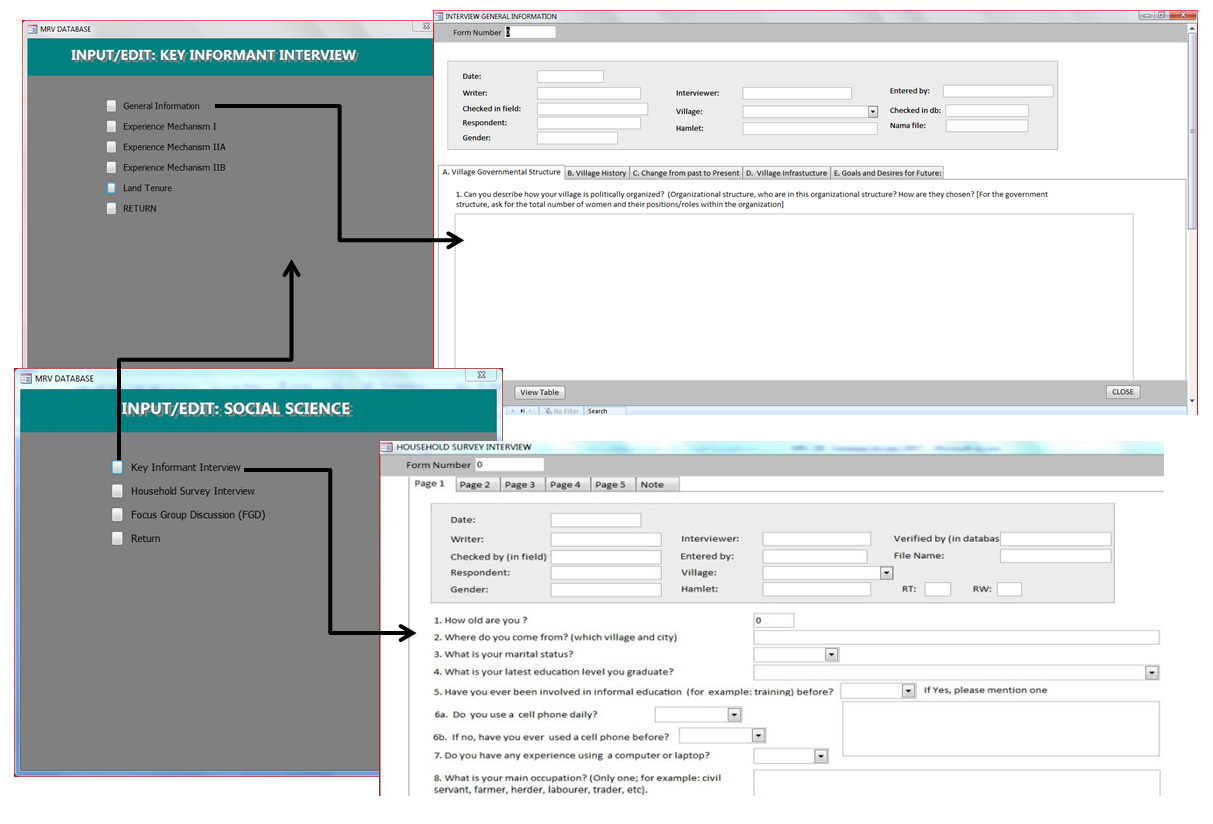
The first group is the social science database. It consists of tables on the following:
- household surveys
- general information
- key informants 1-3
- land tenure
- forest management
- drivers of change
- participatory mapping
- seasonal calendar
- sociogram.
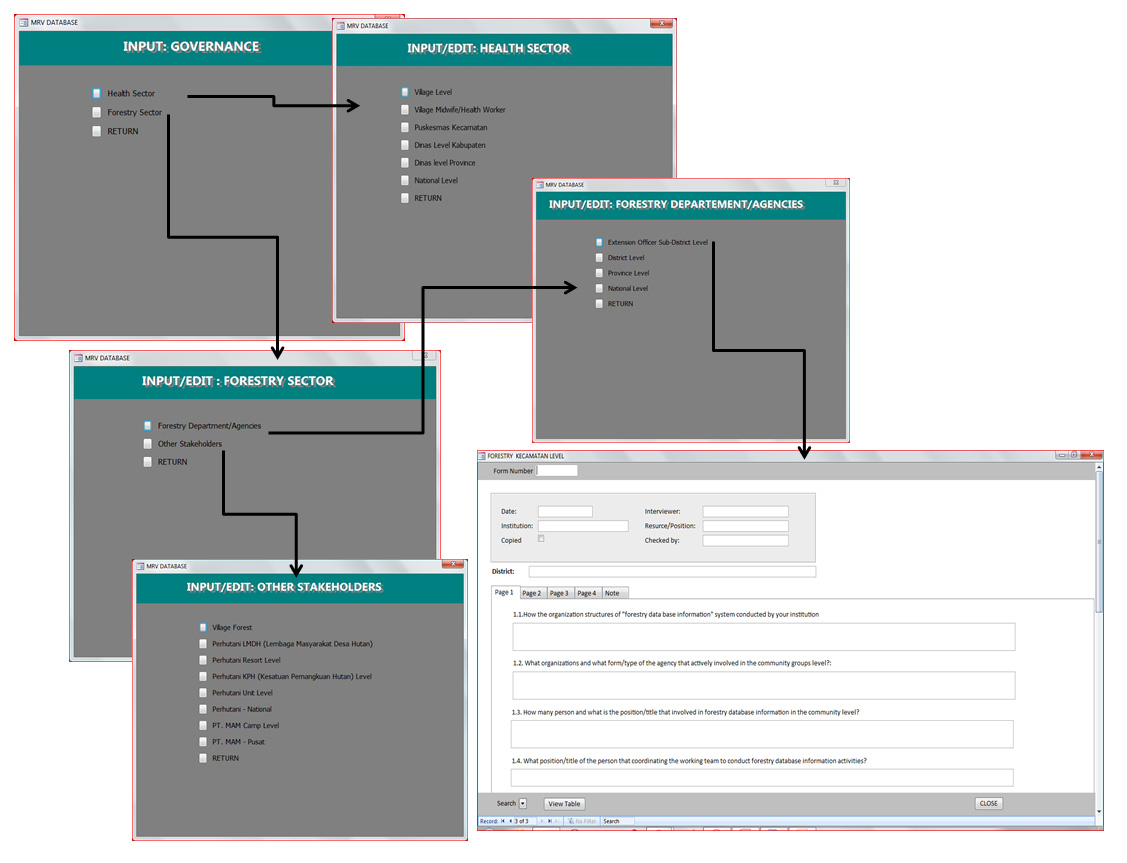
The second group is the governance database. It has two sections: one for data from the healthcare team and one for data from the forestry database team. Together, there are 18 main tables, each with sub-tables and sub-forms.
The healthcare database consists of tables on the following:
- the volunteer (kader) interviews at the village level
- the midwife and village nurse interviews at the village level
- the public healthcare clinic (puskesmas) interviews at the sub-district level
- the district health department (family health and/or nutrition section) interviews
- the provincial health department (family health and/or nutrition section) interviews
- the Ministry of Health interview at the national level: Directorate General of Nutrition, Maternal and Child Health (Direktorat Jenderal Bina Gizi dan Kesehatan Ibu dan Anak).
The forestry database consists of tables on the following:
- village forest manager interviews at the village level
- forestry field extention officer interviews at the sub-district level
- forestry service interviews at the district level
- forestry and extention service or agency interviews at the provincial level
- the ministries/agency interviews at the national level
- the Indonesia state-owned forest company (Perhutani): Forest Village Community Council (Lembaga Masyarakat Desa Hutan-LMDH) interviews
- Perhutani interviews at the resort level
- Perhutani interviews at the Forest Management Unit (Kesatuan Pengelolaan Hutan/KPH) level
- Perhutani interviews at the Province (Unit I) level
- Perhutani interviews at the national level
- PT. Mamberamo Alas Mandiri (MAM) interview at the campsite level
- PT. Mamberamo Alas Mandiri interview at the national level.
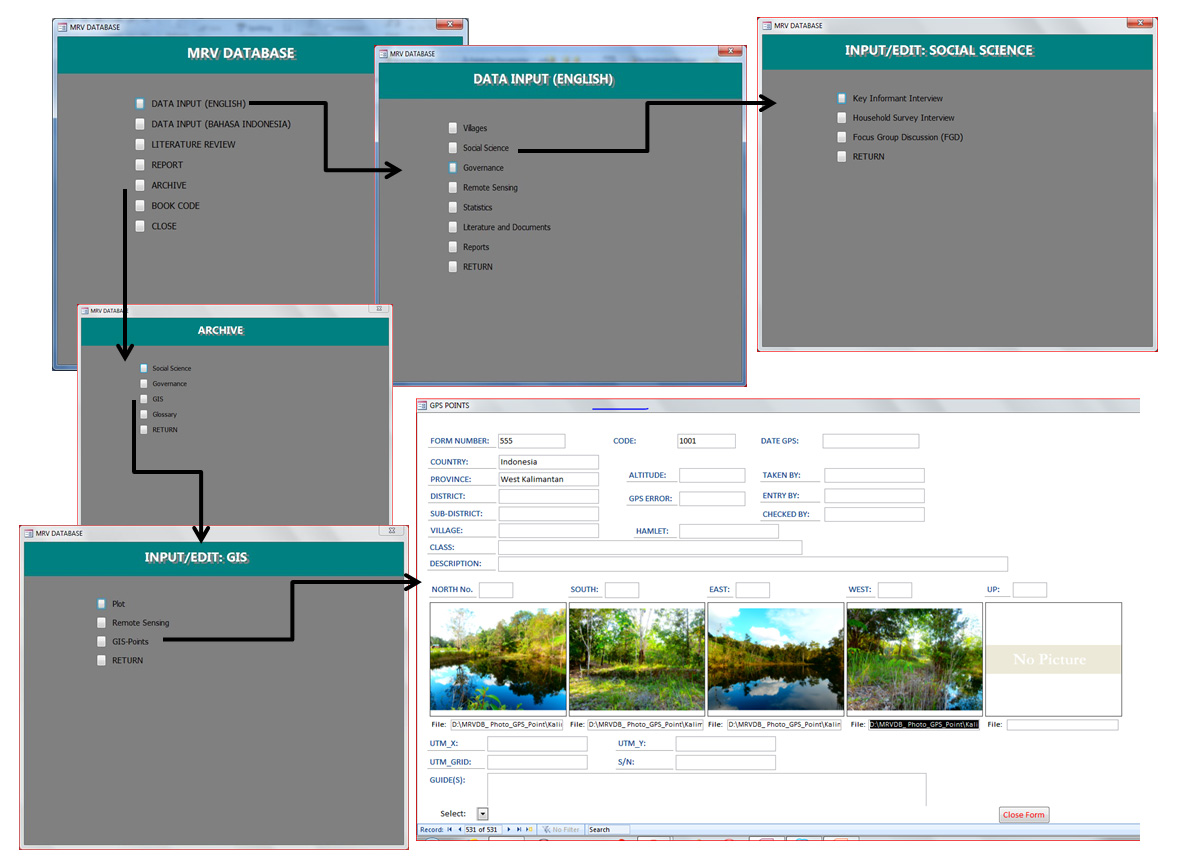
The third group is the GIS and GPS database. It consists of GPS points and descriptions of locations produced during ground checks, including latitude and longitude information, written descriptions of the surrounds of each GPS point, and images taken from all directions (north, south, east, west and above).
The fourth group is the project's Archive Database. The archive data consists of scanned, completed datasheets from the field, for example household survey forms and focus group discussion data.
Below are screen shots from the database showing some examples of the forms/datasheets used, and the links between the different levels of the database:
Creating reports from the database:
We can create reports using MS Access by making a query. A query retrieves the specific data we need from a table or a combination of tables that link to each other. For example, if we want to know how many males versus females, or children under 5-years old versus over 5-years old live in a particular village, we can directly extract the data from the education table.
