
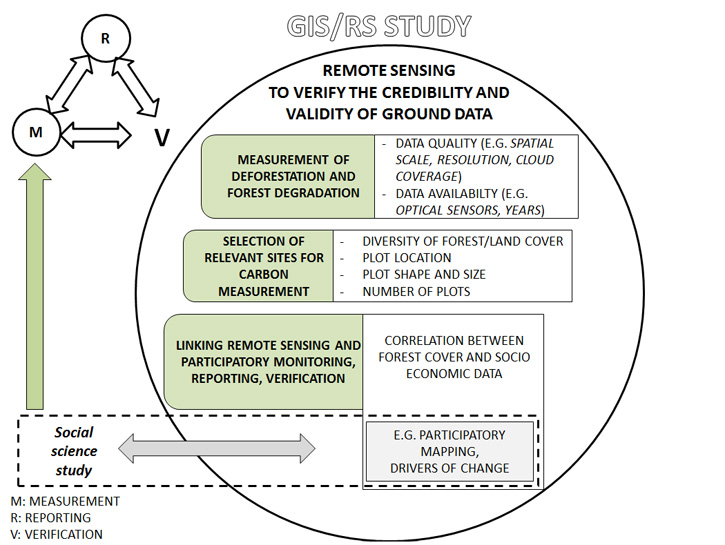
- PMRV
- Activities
- RS/GIS
- Methods
Methods
Source: Boissière M., G. Beaudoin, C. Hofstee, S. Rafanoharana. 2014. Participating in REDD+ Measurement, Reporting, Verification (PMRV): opportunities for local people ? Forests (5): 1855-1878.
Recent studies show that tropical forests suffer more deforestation than other forested landscapes. This is mainly due to the conversion of forests to land used for agriculture, fuel and charcoal production, and mining. Technological advances in satellite sensors that provide images of global forest coverage have enabled the option to monitor forest-cover changes in a timely and consistent manner.
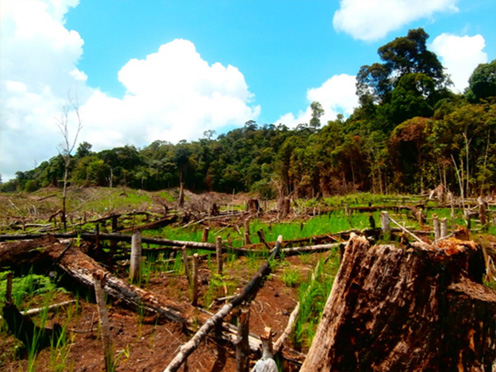 Forest cleared for swidden cultivation. Photo by Serge Rafanoharana. October 2013. Location: West Kalimantan, Indonesia
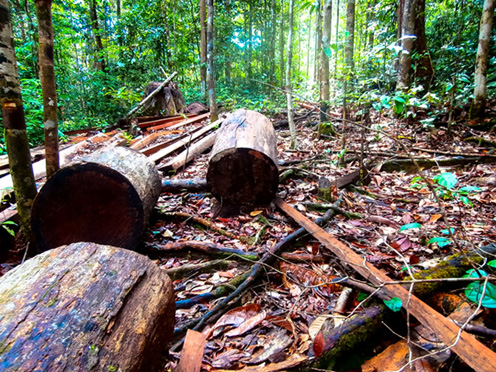 Logs of wood deep inside the forest. These woods were cut and shaped into rectangular shapes so it could be carried easily. Photo by Serge Rafanoharana. October 2013. Location: West Kalimantan, Indonesia
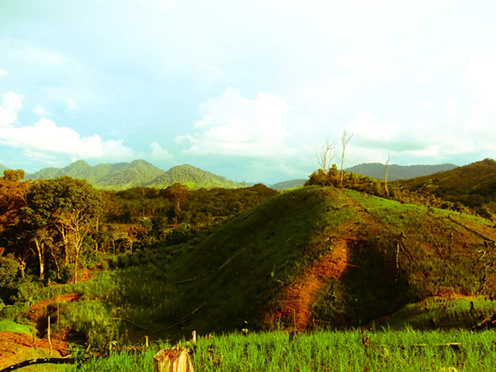 Dried paddy-field. The rice were harvested once a year and mainly used for family consumption thoughout the year. Photo by Serge Rafanoharana. October 2013. Location: West Kalimantan, Indonesia
This project uses time series data from different satellite sensors to generate information on land-cover change over the last decade in three forested regions (i.e. Papua, West Kalimantan and Java) in Indonesia. Preliminary analysis suggested that these sites represent different compositions of forest structure (i.e. forest mosaic, young secondary forest, old secondary forest and pristine forest) impacted by different scales of deforestation and forest degradation.
Prior to applying land-cover classification and analysis, satellite data was preprocessed to correct for atmospheric disturbance and terrain effects. We assessed the performance of parametric and non-parametric classification methods to detect local deforestation and forest degradation. Information obtained from local key stakeholders, through community based mapping, was combined with the ground check information to increase the accuracy of land-cover analysis.
What types of data are we using?
The first set of data for this study is Landsat Thematic Mapper 5. Time series data is required to conduct an analysis of the changes in forest cover. Data from 1991, 1994, 1997, 2000 and 2005 were collected with a spatial resolution of 30 m.
The second set of data is Système Pour l'Observation de la Terre (SPOT). Data, SPOT 1 and SPOT 5, were purchased from the years 2001 and 2011 respectively. SPOT 1 has a spatial resolution of 20 m for multispectral band and 10 m for panchromatic, while SPOT 5 has a spatial resolution of 10 m for multispectral band and 5 m for panchromatic.
The third remote sensing data used in the research is RapidEye. It was purchased as a time series from the years 2010, 2011 and 2012. It has a spatial resolution of 5 m for multispectral bands.
The last data used is Advanced Land Observing Satellite employing Phased Array type L-band Synthetic Aperture Radar (ALOS PALSAR) from the year 2010, with a spatial resolution of 12.5 m.
The changes in vegetation cover seen in the time series data described were analyzed using information from spectral response to identify different stages of forest regeneration and disturbances. The arithmetic combinations from the several spectral bands were also used to detect deforestation and forest degradation. Several vegetation indices, which indicate forest photosynthesis and respiration, and common band ratios were used to measure forest degradation. The extent of degradation was measured as a decrease in the value of these vegetation indices.
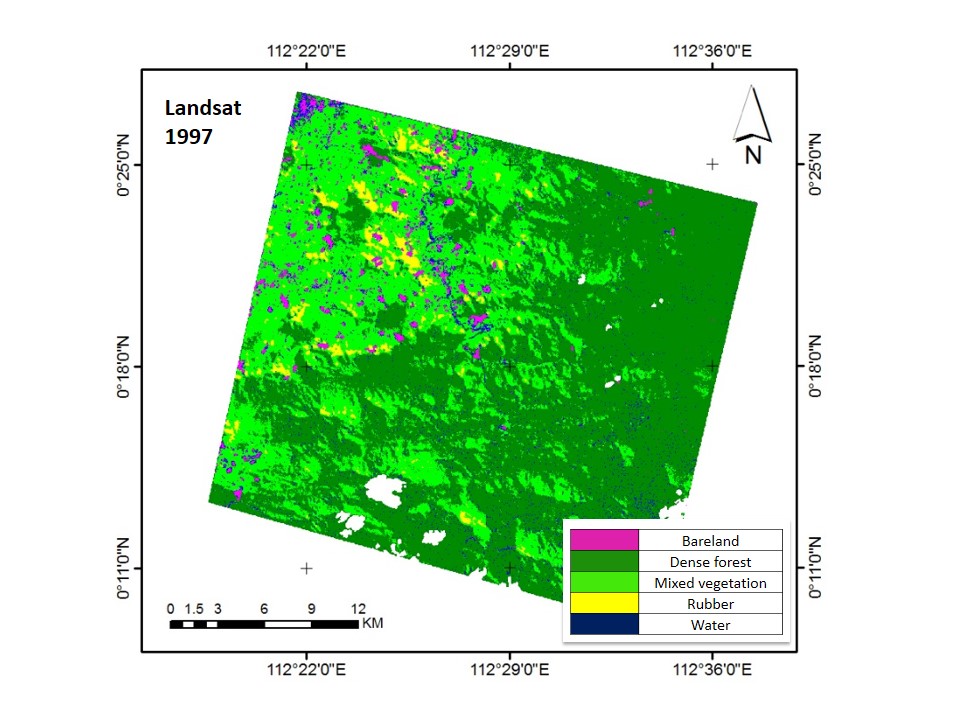
 Land cover classification based on Landsat imagery - Year 1997. Location: West Kalimantan, Indonesia
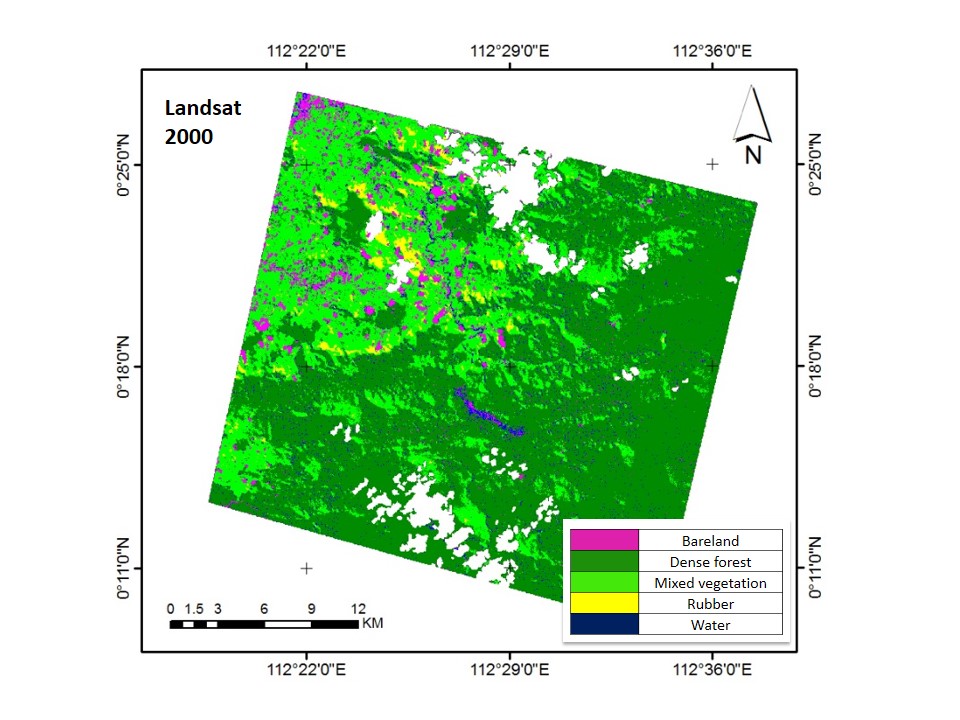
 Land cover classification based on Landsat imagery - Year 2000. Location: West Kalimantan, Indonesia
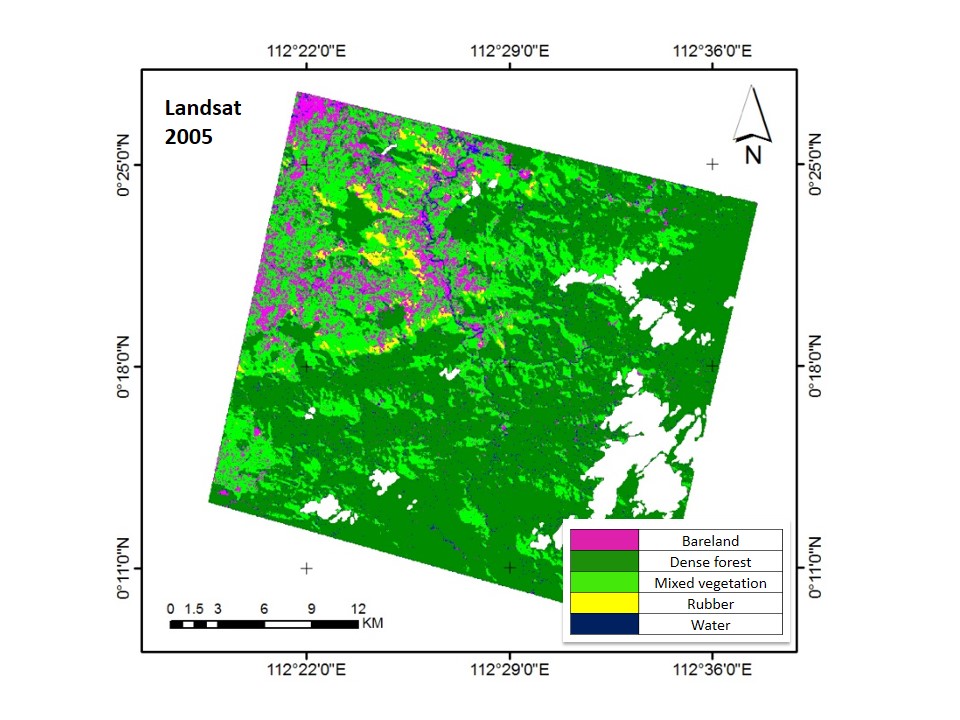
 Land cover classification based on Landsat imagery - Year 2005. Location: West Kalimantan, Indonesia